3D Tour de France Visualization

The Challenge
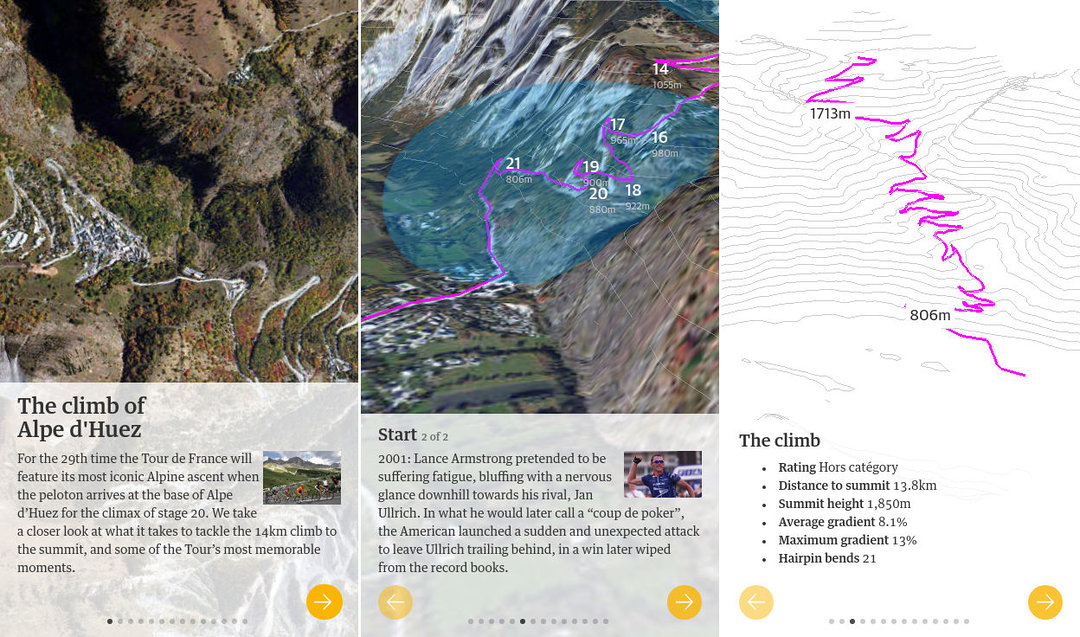
The project's objective was to create a data visualization showcasing the history of the Tour de France’s most renowned hill climb, Alpe D’Huez. The challenge lay in effectively combining satellite imagery with precise elevation data to reconstruct the mountain course in 3D WebGL. Additionally, it was crucial to optimize the user experience (UX) for mobile devices, which involved implementing intuitive tap and swipe navigation. Catering to a wide range of users, the project also required the development of a non-WebGL alternative for compatibility with older browsers.
The Solution
Working collaboratively with a team, I led the development of a 3D WebGL reconstruction of Alpe D’Huez, enhancing the data visualization with accurate topographical details. To ensure a seamless mobile experience, I tailored the UX for touch interaction, addressing screen size limitations while maintaining smooth 3D animations on supported devices. In instances where 3D support was unavailable, the solution gracefully transitioned to image fade transitions.

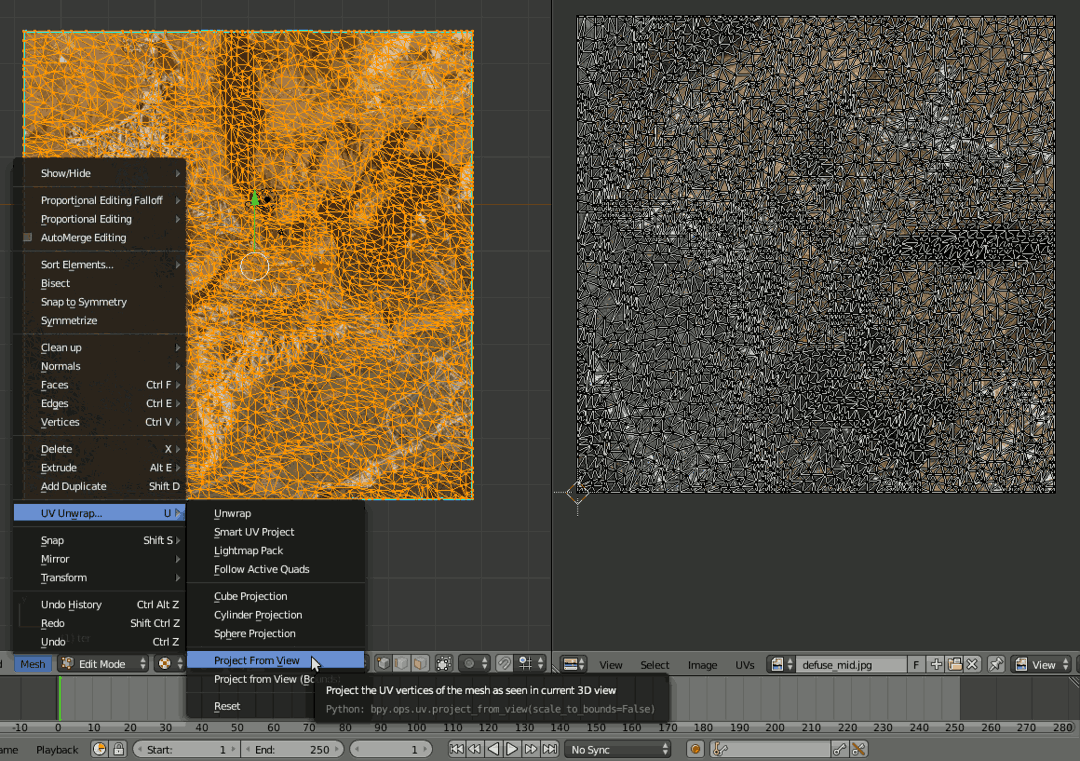
A significant aspect of the project involved optimizing 3D assets. I utilized Blender to reduce the polygon count, which effectively decreased the file size and ensured rapid loading times. Furthermore, I developed a custom GUI editor interface, enabling visual adjustments and fine-tuning of animation values. This interface played a crucial role in creating the animated transitions, allowing for precise control over the user's journey through the stages of the race.

My detailed account of the development process, including how the 3D model was generated, is available on Source, providing an in-depth view of the technical and creative solutions implemented in this project.