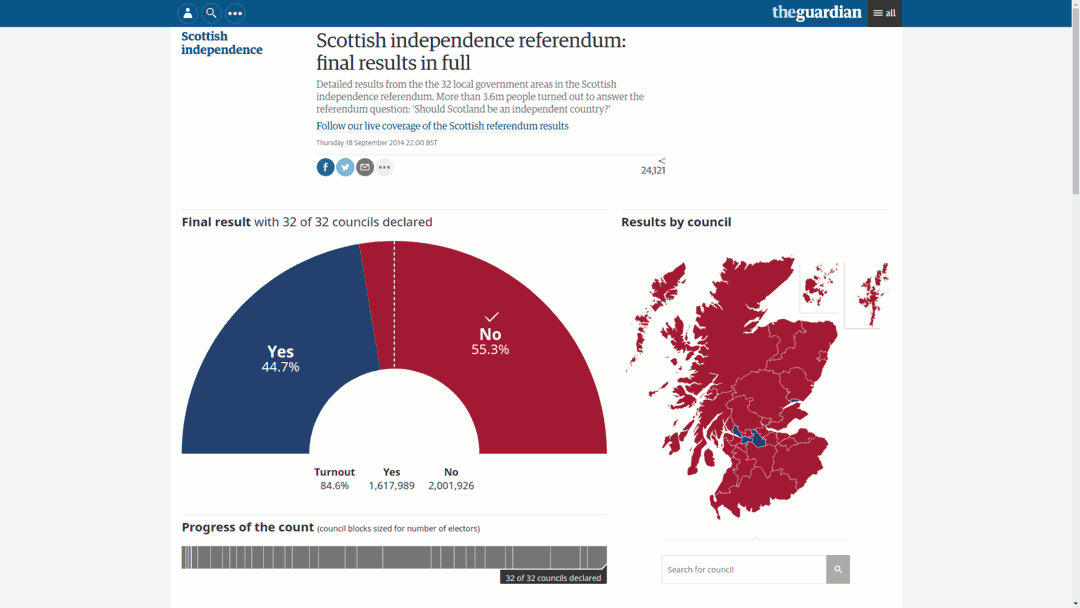
Real-Time Scottish Referendum Dashboard

The Challenge
In the context of the Scottish independence referendum, our team faced the challenge of presenting live, complex referendum results in an accessible and engaging way.
The objective was to create a real-time data visualization dashboard, showcasing the unfolding results of the Scottish referendum.
This task required a solution that not only handled dynamic data efficiently but also presented it in a user-friendly manner, ensuring immediate updates from journalists in the field were reflected promptly on the viewers' screens.
The Solution
To address this challenge, I developed a robust Node.js workflow designed to interface seamlessly with a Google spreadsheet, extracting data and converting it into JSON format.
Once processed, the data was then uploaded to an Amazon S3 bucket for reliable storage and accessibility.
The key feature of our solution was the in-browser polling of this JSON data, which fed into the rendering of an interactive map and various charts using D3.js.
This setup allowed for instantaneous data updates: as journalists updated the information in the spreadsheet from the field, these changes were reflected on the dashboard within seconds. This not only ensured real-time data accuracy but also enhanced user engagement by providing up-to-the-minute results.